Program Insights

Understanding Welbi's Program Insights

This article provides an explanation of all the insights available under the 'Programs' tab.

This insight explains what each of the Program Insights tells you, along with how the insight is calculated where applicable. Note that the dataset used to calculate each insight will depend on the filters you have set at the top of the page. 

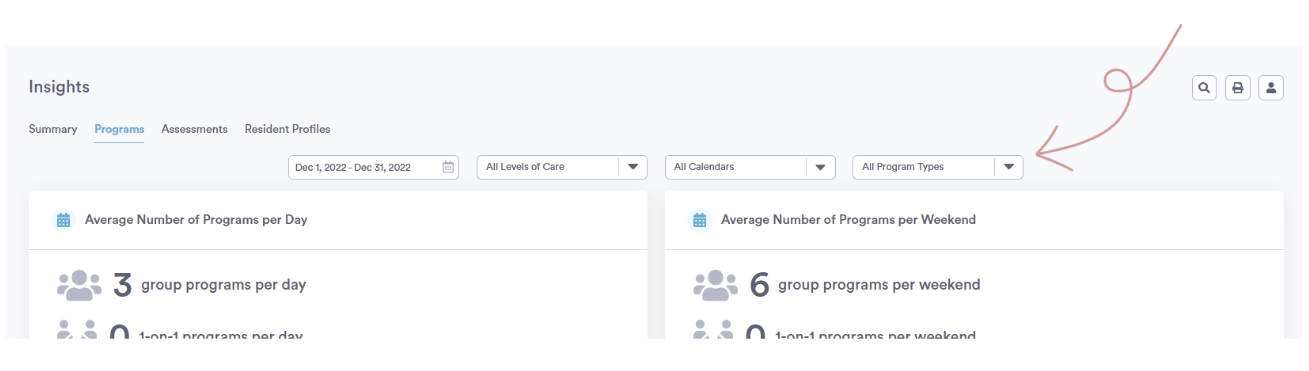
Average Number of Programs per Day

This insight tells you, for the date range chosen, how many programs were offered per day on average.

The average number of programs per day is calculated by taking the total number of programs offered over the chosen date range, and dividing this by the number of days in the chosen date range.

Average Number of Programs per Weekend

This insight tells you, for the date range chosen, how many programs were offered per weekend on average.

The average number of programs per day is calculated by taking the total number of programs offered on either a Saturday or a Sunday, and dividing this by the number of weekends in the chosen date range.

Most & Least Attended Programs

This insight lists your top 5 most and least attended events during the chosen date range. You can click on any of the program names in this insight to be brought to its attendance page, where you can see the full program details and attendee list.

Note that any programs missing attendance (i.e., programs with 0 attendees) will show up in the 'Least Attended' list, so it's important to ensure that your team is up to date on their attendance documentation to get full value out of this insight!

Resident Hobbies vs. Programs Offered

This insight tells you how many residents are interested in a particular hobby/interest, as well as how many times you've offered a program related to that same hobby/interest over the chosen date range.
For more information on this insight, check out this article.

Total Number of Cancelled Programs

This insight tells you how many programs were canceled during the chosen date range, as a count (#) as well as a percentage (%).
The percentage is calculated by taking the number of programs that were canceled over the chosen date range, and dividing this number by the total number of programs offered over the chosen date range.

Reasons for Program Cancellation

This insight tells you how many programs were canceled for each of the available cancellation reasons during the chosen date range.
You can click the button with the 3 dots in the top right of the insight panel to toggle between a bar chart view (which will give you the counts for each reason) and a pie chart view (which will give you the percentages for each reason).
The percentage for each reason is calculated by taking the number of programs that were canceled for that particular reason during the chosen date range, and dividing this number by the total number of programs that were canceled over the chosen date range. 

Programs Without Attendees

This insight tells you how many programs were documented as having no attendees, as a count (#) as well as a percentage (%).
The percentage is calculated by taking the number of programs that were documented as having no attendees over the chosen date range, and dividing this number by the total number of programs offered over the chosen date range.

Average Number of Programs Attended per Resident

This insight gives you a general idea of how engaged your residents were on average over the chosen date range by calculating an average number of programs attended per resident.
This number is calculated by taking the total number of program attendances documented in Welbi over the chosen date range, and dividing it by the total number of residents who were living in the community over the chosen date range. 

Resident Attendance

This insight lets you set an attendance goal for your community, and see what percentage of your residents have achieved (or not achieved) this goal over the chosen date range. For more information on this insight, check out this article.
The percentage is calculated by taking the number of residents who met the attendance goal and dividing this number by the total number of residents who were living in the building for any portion of the chosen date range.

Attendee Engagement over Time

This insight gives you a visual of how your attendee's engagement has fluctuated over the chosen date range. 
The colored lines represent different engagement levels, as described in the color legend at the top of this insight, and each point on the x-axis represents a specific date during the chosen date range. If you hover over a specific point on a colored line, you can see what percentage of attendees on that date had that particular engagement level.
This percentage is calculated by taking the number of attendees documented as having that particular engagement level on that date, and dividing it by the total number of program attendances documented on that date.

% of Facilitators' Time Spent in Programs 

This insight assumes that each of your facilitators is working full-time hours (i.e., 37.5 hours each week), and tells you for the chosen date range what percentage of their working hours are spent in programs.

To calculate this percentage, Welbi starts by finding all of the programs a particular facilitator is listed on in the chosen date range, and then adding up the durations of these programs to get the facilitator's total number of hours spent in program. Then, this value is divided by their total number of working hours in the chosen date range (based on a 37.5 hour work week) to get their percentage of time spent in programs.

Program Time by Facilitator

This insight tells you how many hours each facilitator spent in programs during the chosen date range, and what percentage of the total number of programming hours they were responsible for during the chosen date range.  
You can click the button with the 3 dots in the top right of the insight panel to toggle between a bar chart view (number of hours) and a pie chart view (percentage of hours).
The number of hours of program time for each facilitator is calculated by finding all of the programs a particular facilitator is listed on during the chosen date range, and then adding up the durations of these programs. 
The percentage of the total programming time each facilitator was responsible for is calculated by taking the number of hours of program time for a particular facilitator, and dividing this number by the total number of programming hours that took place during the chosen date range.

Total Number of Programs by Tag

This insight tells you how many programs were run with each of your organization's tags during the chosen date range.

Total Attendance by Program Tag

This insight tells your the total number of program attendances documented for programs with each of your organization's tags over the chosen date range.

Average Attendance by Program Tag

This insight tells you how many attendees were present at each program on average, for each of your organizations tags. 
This average is calculated by taking the total number of program attendances documented for programs with a particular tag, and then dividing this number by the total number of programs with that particular tag over the chosen date range.

Total Number of Programs by Primary Dimension of Wellness

This insight tells you the total number of programs run for each dimension of wellness during the chosen date range, considering the primary dimension only. 

You can click the button with the 3 dots in the top right of the insight panel to toggle between a bar chart view (number of programs) and a pie chart view (percentage of programs).

The percentage is calculated by taking the number of programs with a particular dimension of wellness listed as the primary dimension, and dividing the number by the total number of programs.

Total Number of Programs by Dimension of Wellness

This insight tells you the total number of programs run for each dimension of wellness during the chosen date range, regardless of whether the dimension was listed as the primary dimension or not. 

For instance, if a program has both Spiritual and Physical dimensions listed on it, it will be counted towards both dimensions in this insight.

Total Number of Residents Attending at Least 1 Program by Dimension of Wellness

This insight tells you the total number of residents who have attended at least 1 program within a particular dimension of wellness during the chosen date range.

Total Attendance by Dimension of Wellness by Time of Day 

This insight tells your the total number of program attendances documented for programs with a particular dimension of wellness, broken down by time of day (i.e., morning, afternoon, and evening).

Average Number of Programs by Time of Day

 This insight tells you how many programs were run on average during each time of day (i.e., morning, afternoon, and evening) during the chosen date range.
This average is calculated by taking the total number of programs run during a particular time of day (i.e., morning, afternoon, and evening) during the chosen date range, and dividing this number by the number of days in the chosen date range.

Total Attendance by Time of Day

 This insight tells your the total number of program attendances documented for programs occurring during each time of day  (i.e., morning, afternoon, and evening) during the chosen time period.